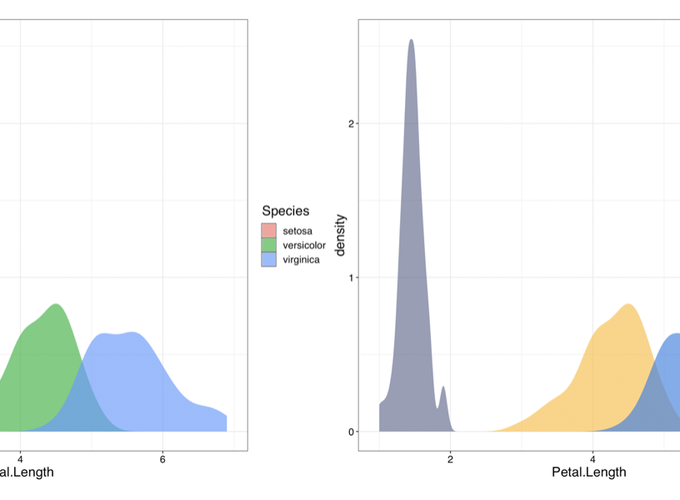
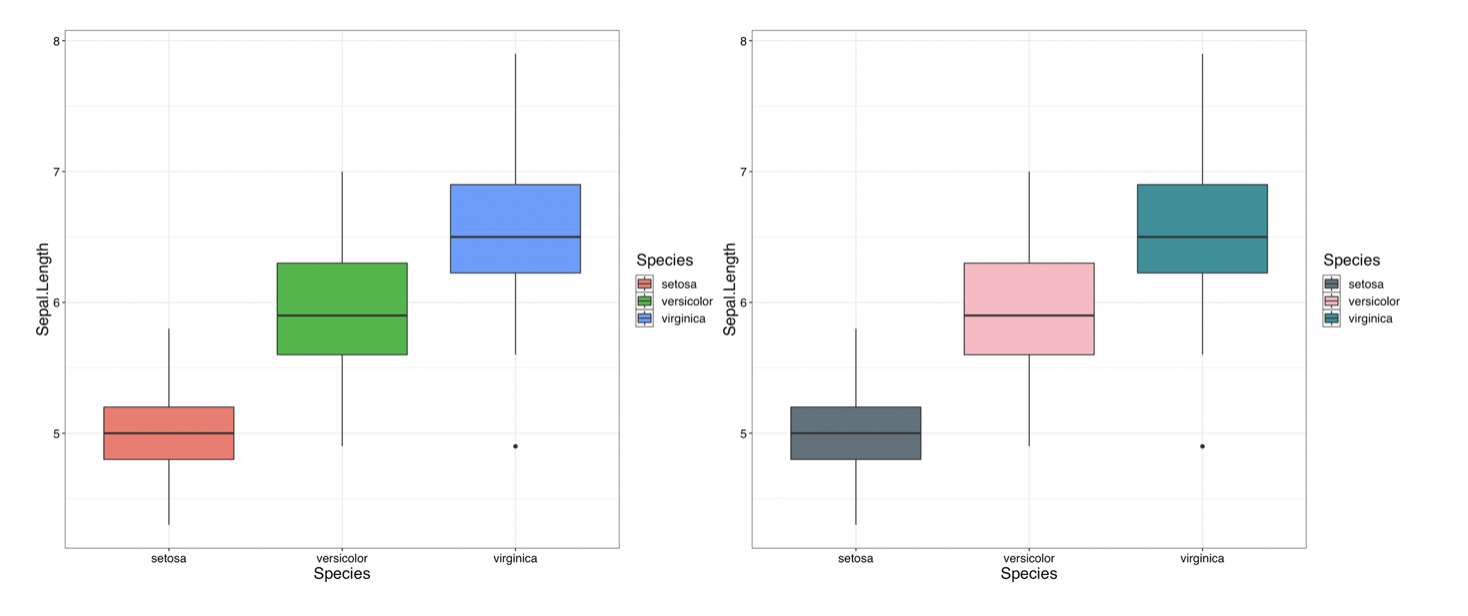
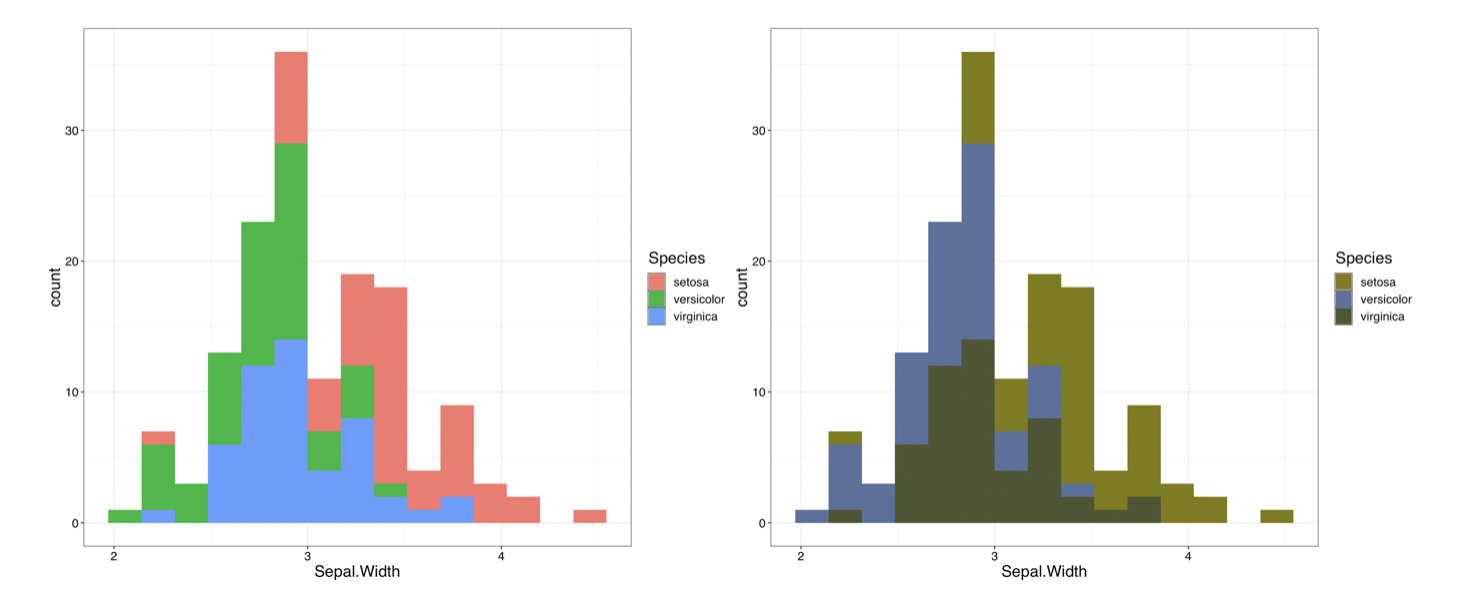
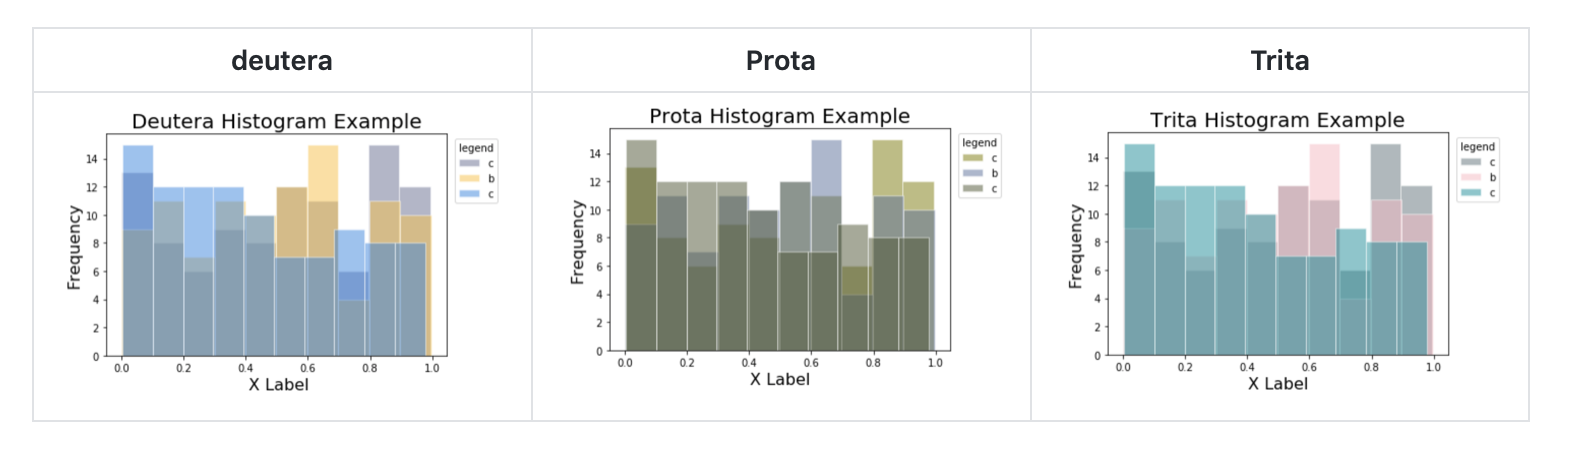
Colourblindness, also known as colour vision deficiency, is a condition that affects individuals how they perceive colours. Colourblindness affects 1 in every 12 men and 1 in every 200 women globally [source]. This fact inspired my team and I to create a package that accommodates people without knowledge about this condition to make their graphs accessible to all. The objective of these packages is to enhance data visualization by implementing proper colours so that the graphs are perceived correctly by all readers as intended.
The packages are available for installation from the repository links listed below:
The repository includes methods and implemention examples.
- Travis was used for continuous integration
End Notes / TLDR:
- Created a python and R package that modifies plots to be colourblind friendly in nature
- The source code and implementation can be found on Github
Traviswas used for continuous integration